The CLS Cumulative Layout Shift, or unexpected content movement, is a user-centric metric for measuring visual stability, and helps to see how many users experience changes in web layout unexpectedly.
The CLS Cumulative Layout Shift is a user-centric metric for measuring visual stability, and helps to see how many users experience changes in web layout unexpectedly.
Within Web Development, CLS is a measure that gives us Google Page Speed and should be less than 0.1. The lower it is, the more stable the loading will be.
.

But since this blog is development. Let’s see, because there are times when Page Speed, points us to a total measurement, but we want to detect where this problem is caused. Many times, it is not as intuitive as we usually put in many examples.
If we use Google Chrome, in the console, we can activate the option
Layout Shift Regions, which colors the rendering and shows us the points on the web that cause a larger CLS.
- Three dots
- Run Command > Show Rendering
- Enable Layout Shift Regions

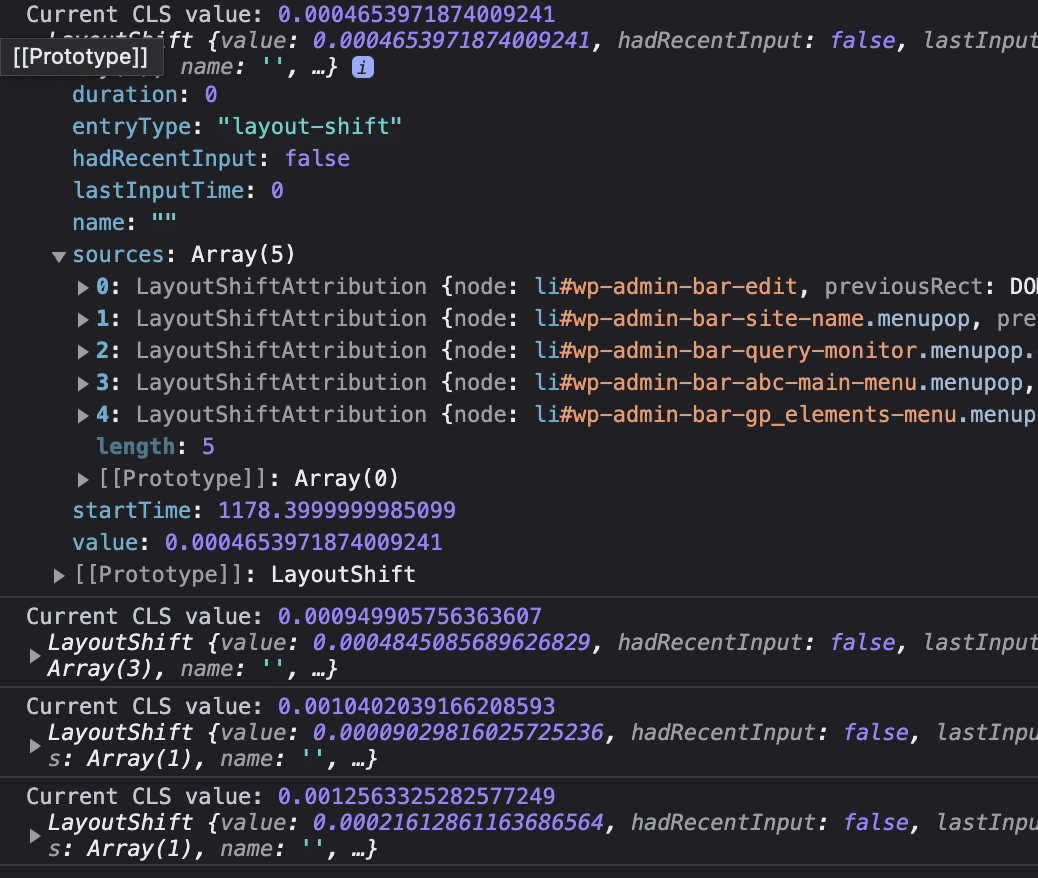
And to have even more information, in the console tab, we can implement this code, which will give us exact values of the elements causing such problems.
let cls = 0;

new PerformanceObserver((entryList) => {
  for (const entry of entryList.getEntries()) {
    if (!entry.hadRecentInput) {
      cls += entry.value;
      console.log('Current CLS value:', cls, entry);
    }
  }
}).observe({type: 'layout-shift', buffered: true});
Once you run that routine, it will give you the different HTML elements that cause the problem.

Normally this is solved with CSS on the elements that create such a problem.